
Customer Lifetime Value: The Founder's Guide to Calculating and Growing It
By Vora IQ Team
Learn how to calculate and grow customer lifetime value to enhance revenue, optimize budgets, and drive sustainable business growth.
- customer lifetime value

Customer lifetime value (CLV) is the total revenue or profit a business can expect from one customer for as long as that customer stays. The simple version: CLV = Average Purchase Value multiplied by Purchase Frequency and Customer Lifespan. Once you know this number, three things happen fast.
- You stop guessing at marketing budgets and start setting them against real payback math.
- Retention becomes a growth lever, not an afterthought buried in a support ticket queue.
- Revenue forecasting gets grounded in customer behavior instead of hope.
If you build nothing else from this guide, build the habit of checking CLV every quarter. It’s the single number that tells you whether your business gets stronger or weaker as it grows.
Key Takeaways
Customer lifetime value works best when calculated by cohort, expressed in margin-adjusted terms, and reviewed against CAC every quarter rather than once a year.
| Point | Details |
|---|---|
| Use the right formula | Start with Average Purchase Value × Frequency × Lifespan, then adjust for gross margin before budgeting. |
| Calculate by cohort | Blended churn hides early-lifecycle drop-off; segment by signup month for accuracy. |
| Watch the LTV:CAC ratio | Aim near 3:1 as a general benchmark, adjusted for your specific business model. |
| Prioritize retention first | Retaining customers costs far less than acquiring new ones and compounds CLV fastest. |
| Automate the tracking | Vora IQ’s Pulse system keeps cohort and revenue signals current without manual spreadsheet work. |
Table of Contents
- What Is Customer Lifetime Value, Really?
- Historical CLV vs. Predictive CLV: Which One Should You Trust?
- Why Customer Lifetime Value Should Drive Your Decisions
- How to Calculate Customer Lifetime Value: Three Methods
- A Worked Example You Can Copy Into a Spreadsheet
- What Data Do You Need to Measure CLV Accurately?
- How to Increase Customer Lifetime Value: A Prioritized Playbook
- What LTV:CAC Ratio Should You Aim For?
- What Tools Should You Use to Track CLV by Stage?
- Where Customer Lifetime Value Calculations Go Wrong
- A Founder’s CLV Checklist Before You Trust the Number
- How Vora IQ Turns CLV Tracking Into a Habit, Not a Project
- Sources
What Is Customer Lifetime Value, Really?
Customer lifetime value measures what one customer is worth over their entire relationship with you, not just their first purchase. It gets confused with a few neighboring metrics, so let’s separate them.
LTV is usually shorthand for the same thing as CLV. Some teams use it interchangeably; others reserve LTV for SaaS-specific, subscription-based calculations. Don’t stress over the distinction. ARPU (average revenue per user) is a single-period snapshot, usually monthly, and it’s one of the inputs that feeds CLV rather than a replacement for it. CAC (customer acquisition cost) is the mirror image: what it costs you to win a customer, not what they’re worth once won.
Here’s where each version earns its keep:
- Revenue-based CLV works for board decks and top-line growth conversations.
- Margin-adjusted CLV (revenue minus cost of goods and delivery) is what should drive your CAC budgeting, because a customer worth $2,000 in revenue but $200 in profit changes your math entirely.
- Cohort-level CLV is what you need for real growth experiments, since blended averages hide which customer group is actually driving value.
Historical CLV vs. Predictive CLV: Which One Should You Trust?
Historical (observed) CLV looks backward. You take real transaction data from customers who’ve already churned or who’ve been around long enough to trust the pattern, and you calculate what they actually spent. It’s simple, defensible, and immune to modeling errors. Its weakness: it tells you nothing about customers who signed up last month.
Predictive (modeled) CLV looks forward. It uses statistical techniques like survival analysis or machine learning to estimate what a new customer will likely spend before you have years of data on them. It’s more useful for planning but carries model risk. A bad churn assumption compounds into a badly wrong number.
| Stage | Recommended approach | Why |
|---|---|---|
| Seed / pre-PMF | Historical, cohort-based | Data is too thin for reliable modeling |
| Growth | Blend of historical + light predictive | Enough data to trend, not enough for full ML |
| Scale | Predictive modeling | Volume supports statistical confidence |
- At seed stage, trust what happened, not what a model predicts.
- At growth stage, use predictive estimates for planning but validate them against real cohort data monthly.
Why Customer Lifetime Value Should Drive Your Decisions
CLV isn’t a vanity metric for the annual report. It’s the number that should sit next to every major decision you make.
Consider three scenarios. If your CLV is substantially higher than your CAC, you have room to spend more aggressively on acquisition than a competitor with a lower ratio. If a proposed feature costs three months of engineering time but doesn’t move retention, CLV tells you it’s probably not worth building yet. If a loyalty program costs $15 per customer per year, CLV tells you almost immediately whether that spend pays for itself.
CLV also connects directly to your unit economics and revenue forecasting. A business with rising CLV and flat CAC is compounding in your favor. One with flat CLV and rising CAC is quietly eroding.
- Report CLV alongside CAC and payback period every month, not once a year.
- Treat a declining CLV trend as an early warning system, not just a lagging scorecard.
How to Calculate Customer Lifetime Value: Three Methods
You have three real options, ranked by effort and precision.
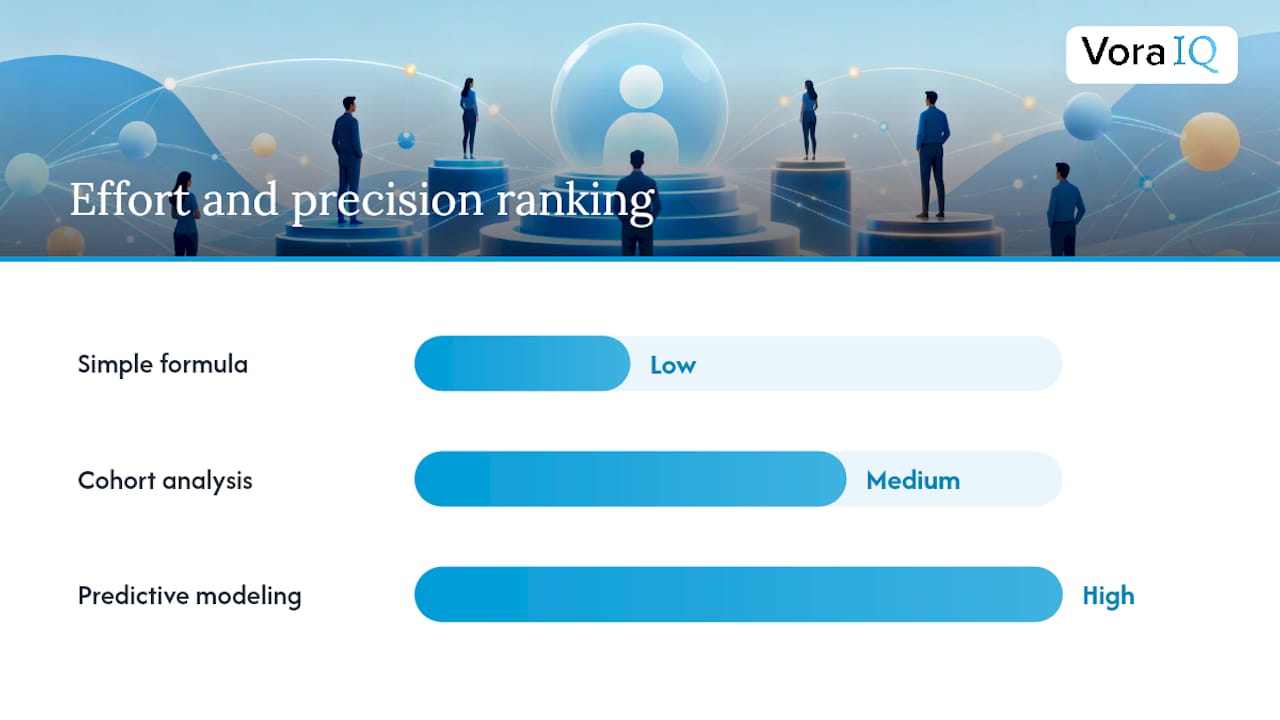
1. The simple formula. Multiply average purchase value by purchase frequency, then multiply that by average customer lifespan:
CLV = (Average Purchase Value × Purchase Frequency) × Average Customer Lifespan
For subscription businesses, the common SaaS shortcut is ARPU divided by your monthly churn rate, which gives you the expected total revenue per customer. Add a gross-margin multiplier if you want a profit view instead of a revenue view. That margin-adjusted version is usually the one that should inform actual spending decisions, since revenue-only CLV can make a low-margin customer look far more valuable than they are.
2. Cohort analysis. Group customers by the month or quarter they signed up, then track how each group’s revenue and retention evolve separately. This avoids the classic blended-churn trap: new customers often churn at a much higher rate in their first few months than long-tenured ones, and averaging them together can inflate your apparent CLV. Cohort math takes longer to set up but tells you the truth about where value actually comes from.

3. Predictive modeling. Survival analysis estimates the probability a customer stays active in any given period. Discounted cash flow (DCF) models bring future revenue back to today’s dollars, useful when you’re pitching investors on long-term value. Both require enough historical data to calibrate. If you don’t have a data scientist on staff, most SaaS LTV calculators will run simple, margin-adjusted, and DCF versions side by side so you can compare.
Whichever method you pick, you’ll need these inputs pulled from your systems:
- Average order value or ARPU from your billing platform
- Purchase or renewal frequency from your CRM
- Monthly or annual churn rate from your analytics tool
- Gross margin per customer or per plan tier
A Worked Example You Can Copy Into a Spreadsheet
The simple formula estimates this customer is worth a significant amount over their lifetime. The margin-adjusted version, which should guide your CAC ceiling, shows a notable difference. That’s a meaningful gap if you’re setting acquisition budgets off the wrong line.
Now flex the inputs. Small changes to churn and ARPU can significantly extend customer lifespan and increase margin-adjusted CLV, demonstrating how sensitive CLV is to these inputs. Small input changes compound fast, which is exactly why sensitivity testing matters more than chasing a single precise number.
What Data Do You Need to Measure CLV Accurately?
Good CLV math starts with clean inputs, not a fancier formula. You need five numbers: average order value, purchase frequency, retention or churn rate, gross margin, and CAC. Miss one and the whole calculation drifts.
Pull them from the systems you already run:
- Payment platform (Stripe, for instance) for transaction-level revenue and refund data
- CRM for purchase frequency and account-level history
- Analytics tool for cohort retention curves
- Billing system for churn and plan-tier data
Use a 12 to 24 month lookback window where possible. Shorter windows undersell lifespan; much longer windows can bake in outdated pricing or product versions.
Pro Tip: Deduplicate accounts before you calculate anything. A single customer with two logins or two billing records will quietly inflate your purchase frequency and distort every number downstream.
How to Increase Customer Lifetime Value: A Prioritized Playbook
Not every lever is worth pulling first. Here’s the order that tends to pay off fastest for early-stage teams.
- Reduce churn. This is usually the highest-leverage move, since it costs six to seven times less to keep a customer than to acquire a new one, and a 5% retention improvement can raise profitability by roughly 25%. Test onboarding improvements, proactive check-ins, or a win-back sequence for at-risk accounts.
- Raise average order value. Bundling and tiered pricing are the two most common moves here. A subscription box that bundles three products at a slight discount often lifts AOV without hurting perceived value.
- Increase purchase frequency. Loyalty programs, replenishment reminders, and usage-based nudges all push existing customers to buy or engage more often.
- Revisit pricing and packaging. Sometimes the fastest CLV lift is simply charging closer to the value you deliver, particularly if you’ve added features since your last price review.
For each lever, set a measurement window before you launch it.
- Watch churn or AOV weekly for the first month, not just at quarter-end.
- Flag the risk each lever carries: price changes can spike short-term churn even while raising long-term CLV, so don’t panic at week one.
What LTV:CAC Ratio Should You Aim For?
The standard benchmark is an LTV:CAC ratio near 3:1 for scalable businesses. Below 1:1, you’re losing money on every customer. Between 1:1 and 3:1, you’re viable but thin. Above 3:1, especially closer to 5:1, you may be under-investing in growth and leaving market share on the table.
Benchmark ranges vary by model. SaaS businesses with strong margins often target 3:1 to 5:1. Ecommerce, with thinner margins and shorter customer lifespans, frequently runs closer to 2:1 to 3:1. Enterprise sales, with long payback periods, can justify lower ratios if the absolute contract value is large enough.
Common mistakes when reading this ratio:
- Ignoring payback period, which can hide a healthy ratio built on a dangerously slow cash cycle.
- Using revenue-based CLV instead of margin-adjusted CLV, which flatters the ratio.
- Mixing cohorts with very different churn profiles into one blended number.
Treat both sides of the ratio as dynamic, not fixed. CAC creeps up as channels saturate; CLV shifts as your product and pricing evolve. Re-check quarterly.
What Tools Should You Use to Track CLV by Stage?
You don’t need enterprise software to start. Match the tool to where you actually are.
- Pre-product-market-fit: A spreadsheet with three tabs, cohorts, monthly revenue, and churn, is enough to get a directionally correct number.
- Growth stage: Analytics platforms with built-in cohort views let you automate retention curves instead of rebuilding them by hand each month.
- Scale stage: Predictive SaaS or ML-based modeling becomes worth the investment once you have enough volume for statistical confidence.
Before reaching for anything advanced, run the basics: monthly cohort revenue, churn by signup month, and a simple margin-adjusted CLV calculation. A curated list of founder-friendly tools can help you avoid over-buying software before you’ve validated the basics manually.
Where Customer Lifetime Value Calculations Go Wrong
Most CLV mistakes come from convenient shortcuts, not bad math.
- Blended churn. Averaging all customers together hides the fact that new signups often churn faster than tenured ones.
- Revenue instead of margin. A high-revenue customer with thin margins can look more valuable than they actually are.
- Mixing cohorts. Combining customers acquired through different channels or pricing tiers muddies the signal.
- Short lookback windows. A 30-day window will systematically undersell lifespan and CLV.
Run this quick validation check before trusting a number: recalculate CLV by cohort, apply your gross margin, and flag any outlier accounts skewing the average.
Real CLV shifts that fast are rare.*
A Founder’s CLV Checklist Before You Trust the Number
Run this before you act on any CLV figure:
- Confirm you have at least 12 months of transaction data, deduplicated by account.
- Check cohort-level churn, not blended churn, for your most recent three cohorts.
- Rank improvement levers by impact times ease times how measurable they are.
Pro Tip: Pick one lever, run it for one week, and measure the single metric it should move. A tiny, well-measured experiment beats a big one you can’t attribute.
Why Founders Should Treat CLV as a Live Number
I’ve seen too many founders calculate CLV once for a pitch deck and never touch it again. That’s backward. The moment CLV becomes a weekly or quarterly habit, it starts catching problems before they show up in your bank balance. Run the worked example above this week with your own numbers. If the math gets complicated fast, that’s usually a sign deeper modeling, not more spreadsheet tabs, is what you actually need.
How Vora IQ Turns CLV Tracking Into a Habit, Not a Project
Most of the checklist above takes hours to set up manually and easy to forget once quarter-end pressure hits. Vora IQ builds that tracking into your daily operating rhythm instead of leaving it as a spreadsheet you open twice a year.
The Pulse system monitors the metrics that actually move your business, so cohort churn and revenue trends surface automatically instead of requiring a manual pull every month. Pair that with revenue modeling built into your roadmap, and CLV stops being a one-time calculation and becomes a live signal feeding your next decision, whether that’s a pricing change, a retention experiment, or a pivot conversation with Pivot. If you’re a solo founder trying to run this analysis without a data team, check whether your situation fits on the Vora IQ use cases page and see how the roadmap adapts to your specific stage and numbers.
Sources
- Customer Lifetime Value: What It Is and Why It Matters
- LTV/CAC Ratio: What It Is & How to Calculate It
- How to Calculate, Interpret & Improve SaaS LTV
- SaaS LTV Calculator - SuperCalc