
TAM SAM SOM for Founders: Market Sizing Made Actionable
By Vora IQ Team
Discover how TAM, SAM, and SOM can empower founders with clear market sizing strategies to attract investors and enhance business growth.
- tam sam som

TAM, SAM, and SOM measure three different slices of opportunity. TAM (Total Addressable Market) is every dollar spent on your category worldwide. SAM (Serviceable Addressable Market) is the slice you can actually reach with your product and go-to-market. SOM (Serviceable Obtainable Market) is what you can realistically win given your capacity, price, and competition.
The formulas are simple:
- TAM = total number of potential customers × average revenue per customer (or a top-down category figure from a source like Gartner)
- SAM = TAM × the percentage of that market your product and distribution can actually serve
- SOM = SAM × your realistic capture rate, based on sales capacity and competitive win rates
Use TAM to sell the vision to investors. Use SAM to define your go-to-market focus. Use SOM to build your quota plan and annual operating budget. Government data from sources like the Bureau of Labor Statistics and category reports from firms like Statista or Gartner give you the top-down numbers to sanity-check whatever you build from the bottom up.
Pro Tip: Never pitch SOM as your Year 1 revenue target without showing the sales capacity math behind it. Investors want to see the arithmetic, not just the number.
Key Takeaways
| Point | Details |
|---|---|
| Use each metric for its job | TAM sells vision to investors, SAM sets go-to-market focus, and SOM drives your quota and hiring plan. |
| Build SOM from capacity | Multiply reachable accounts, rep activity, close rate, and ACV instead of guessing a percentage of SAM. |
| Check for parity | Reconcile top-down and bottom-up figures, and revisit assumptions if they diverge by more than 15%. |
| Avoid the SOM equals SAM trap | Claiming 100% market capture with no competition is the fastest way to lose investor credibility. |
| Automate the recalculation | Vora IQ ties market and competitor analysis directly into your adaptive roadmap, so a revised SOM updates your operating plan automatically. |
Table of Contents
- What Do TAM, SAM, and SOM Actually Mean?
- Why Do Investors and Operators Care About This?
- Top-Down vs Bottom-Up vs Value Theory: A Quick Comparison
- How Do You Calculate TAM Using the Top-Down Method?
- How Do You Build a Defensible Bottom-Up SOM?
- When Should You Use Value-Theory Market Sizing?
- What Does a Full TAM to SAM to SOM Example Look Like?
- What Mistakes Make TAM, SAM, and SOM Look Unreliable?
- How Should You Present TAM, SAM, SOM to Investors?
- Where Do You Find Reliable Data for Market Sizing?
- How Do You Validate Your Market Sizing in the Next 90 Days?
- A Founder’s View on Turning TAM Into a Real Plan
- How Vora IQ Helps You Turn Market Size Into a Working Plan
- Sources
What Do TAM, SAM, and SOM Actually Mean?
TAM gets misstated more than any other startup metric. Founders often quote a category-wide figure (“the global project management software market”) without checking whether their product can serve any meaningful fraction of it. That’s not fraud, it’s just sloppy math that experienced investors catch in about ten seconds.
The real definition: TAM is the total revenue opportunity if every possible buyer purchased your type of product at scale, with zero competition. It’s a ceiling, not a forecast.
SAM narrows that ceiling using three filters:
- Product fit — can your current feature set actually serve this segment?
- Geography — do you have the legal, logistical, or language capability to sell there?
- Distribution — can your sales motion (self-serve, outbound, channel partners) actually reach these buyers?
SOM then narrows SAM again, this time by capacity and competition. According to the ORM revenue analytics glossary, SAM filters TAM down to the customers you can realistically serve with your specific product and go-to-market, while SOM filters SAM by the share you can win given your team size and the competitive landscape.
Think of it as three nested circles. TAM is the outer ring representing every dollar in the category. SAM is the middle ring, cropped to your actual reach. SOM is the inner ring, cropped again to what your current team can close this year.
A common mix-up: people use “market size” to mean TAM when they’re actually describing SAM, or they present SOM as if it’s guaranteed revenue rather than a target that depends entirely on execution.
Why Do Investors and Operators Care About This?
Investors and operators read these three numbers for completely different reasons, and conflating the two audiences is where most pitch decks go wrong.
An investor wants TAM to gauge how big the outcome could be if everything breaks right. But they’ll scrutinize SAM and SOM far more closely, because that’s where they judge whether your team understands its own business. A TechCrunch analysis of startup market sizing notes that credible founders back both a top-down TAM and a bottom-up SOM, so the two stories reconcile.
Operators use these metrics differently:
- SOM drives quota setting, hiring plans, and revenue targets for the next 12 to 18 months.
- SAM shapes territory design, product roadmap priorities, and which verticals get sales attention first.
- TAM informs long-range strategy, like whether to raise a larger round or expand internationally in year three.
Prioritization frameworks like RICE scoring work the same way; a big TAM without confidence in your SAM assumptions should trigger discovery work, not a bigger ask deck.
Top-Down vs Bottom-Up vs Value Theory: A Quick Comparison
Three approaches dominate market sizing, and each fits a different stage of company maturity.
- Top-down starts from a published industry figure and narrows it with filters. Fast, but only as good as the source and your filtering logic.
- Bottom-up starts from your actual unit economics (accounts, price, conversion) and builds up. Slower, but far more defensible.
- Value theory estimates what customers would pay based on the value you create, used when no market data exists yet.
HubSpot’s market-sizing guide treats all three as complementary rather than competing. Use top-down for a fast sanity check, bottom-up for anything you show investors as your operating plan, and value theory only when you’re creating a category nobody has measured yet.
How Do You Calculate TAM Using the Top-Down Method?
Top-down calculation works best when credible analyst or government data already exists for your category. Here’s the process:
- Find an authoritative estimate. Pull a category-level figure from a source like Gartner, IDC, Statista, or the BLS for adjacent industries.
- Apply geographic filters. If the report covers North America and Europe but you only sell in the US, cut the figure to the US share the report provides, or find a US-specific breakout.
- Apply segment filters. Narrow by company size, buyer type, or vertical. A report on “enterprise software spend” isn’t your TAM if you sell exclusively to solo consultants.
- Apply price-tier filters. Match the report’s average price point to your actual pricing. If the category average assumes a $50,000 annual contract and you charge $500 a month, adjust the customer count accordingly, not the revenue figure.
- Stress-test the assumptions. Ask what has to be true for this number to hold. Write that assumption down.
Filters worth applying every time: region, company size band, price tier, and whether the report counts revenue or unit volume. A comparison of market analysis tools can help you cross-check multiple top-down sources before you commit to one figure in your model.
Cite your source directly in the model, not just in a footnote. “TAM: $4.2B (Gartner, category X, 2025 US enterprise segment)” is a sentence investors trust. “TAM: $4.2B” alone is a sentence they question.
How Do You Build a Defensible Bottom-Up SOM?
Bottom-up sizing starts with numbers you actually control, which is exactly why investors trust it more. The formula:
SOM = number of accounts you can reach × your realistic close rate × average contract value (ACV)
Build it in a spreadsheet with these fields:
- Addressable accounts — the count of companies matching your ideal customer profile within reach of your current sales motion.
- Activity capacity — how many qualified conversations each rep can run per month, based on your current team size.
- Conversion rate — your actual close rate from qualified conversation to signed deal, pulled from your own funnel data or a comparable benchmark.
- Average contract value (ACV) — your real price point, not an aspirational one.
- Ramp time — how long it takes a new rep to reach full productivity, since year-one capacity is lower than year-two capacity.
Multiply reps × monthly activity × close rate × ACV × 12 months, and you have a spreadsheet-ready SOM. ORM’s glossary on revenue analytics frames SOM this way deliberately: it should be built from operational inputs like reachable accounts, rep ramp, historical close rates, and contract value, not from a percentage guess applied to SAM.
Pro Tip: Pull your close rate from your actual CRM history whenever you have six months of data. A benchmark from someone else’s business is a placeholder, not a number you should defend in a board meeting.

Once you have both a top-down SAM and a bottom-up SOM, check that they tell a consistent story. Document the source for every input, including internal CRM exports, so someone else on your team could rebuild the model without you.
When Should You Use Value-Theory Market Sizing?
Value theory earns its keep when you’re creating a category, not competing in an established one, so no analyst report exists yet to anchor a top-down figure. The formula:
- Estimate the value your product creates for a single customer (time saved, revenue generated, cost avoided).
- Estimate a realistic price-capture rate — the share of that value customers will actually pay, typically 10% to 30% depending on how differentiated your solution is.
- Estimate adoption rate across your target population over a defined period, based on comparable product launches if any exist.
Multiply value created × price capture × expected adopters, and you have a rough SOM. According to TechCrunch’s guidance on early-stage sizing, the right move when category data doesn’t exist is to estimate maximum willingness-to-pay and then run fast customer experiments to validate the adoption curve before you ever present the number to an investor.
Pro Tip: Run a landing-page test or a small paid pilot before you finalize a value-theory number. A dozen real conversations about price beats a hundred spreadsheet cells built on guesses.
What Does a Full TAM to SAM to SOM Example Look Like?
Take a neutral example: a B2B scheduling SaaS tool selling to small dental and medical clinics in the US.
Top-down path: A market report pegs the healthcare scheduling software category at $2.1 billion globally.
Bottom-up path: You count 180,000 addressable small clinics in the US that fit your ideal customer profile. At your $1,200 average annual contract value, that’s a bottom-up SAM of $216 million if every clinic bought.
When methods diverge more sharply, Polaris Market Research’s guide to practical sizing suggests treating anything beyond roughly 15% divergence as a signal to recheck your filters or your capacity assumptions, not as a number to average away.
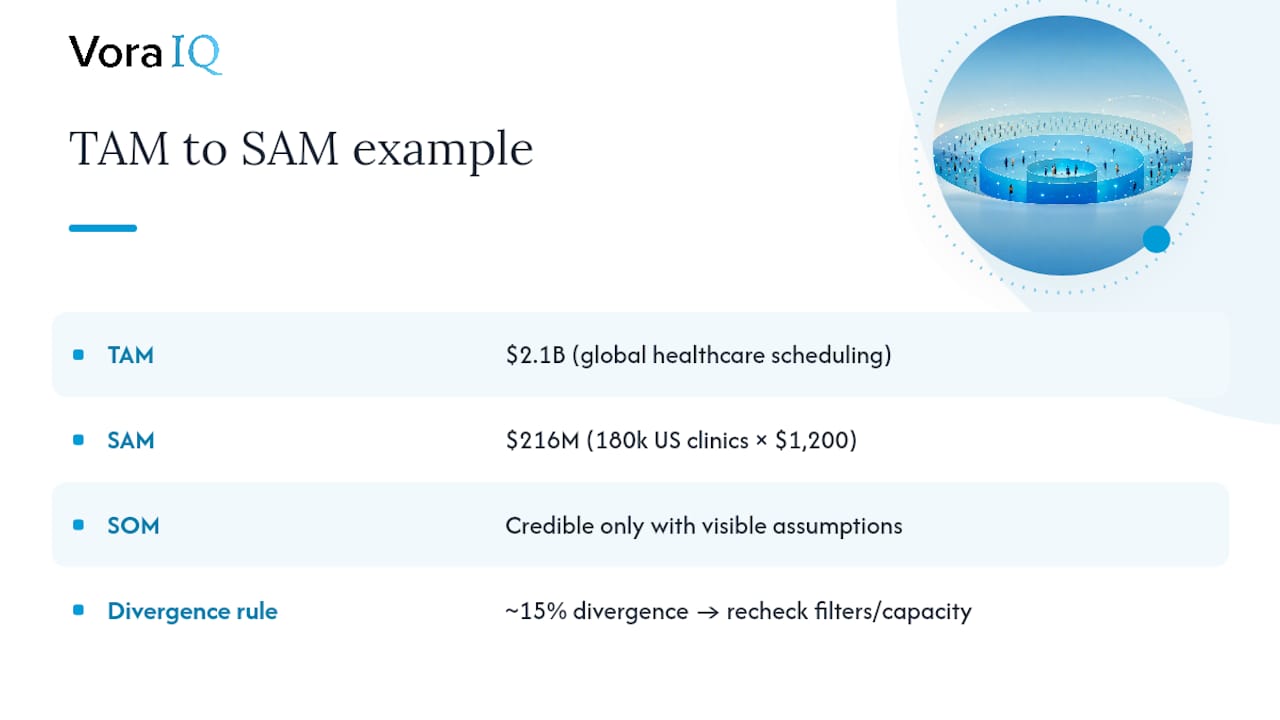
Document every assumption in a visible tab of your model, not buried in a formula. That transparency is what separates a credible SOM from an optimistic guess.
What Mistakes Make TAM, SAM, and SOM Look Unreliable?
Investors have seen thousands of these slides, and certain errors are instant credibility killers.
- SOM equals SAM. If your obtainable market matches your serviceable market, you’re claiming 100% market share with zero competition, which nobody believes.
- Treating TAM as a revenue forecast. TAM is a ceiling on the category, not a projection of what you’ll earn. A common practical error is founders using TAM as their own operating number instead of building SOM from actual sales capacity and win rates.
- Unsupported top-down leaps. Jumping from a $50 billion global category straight to “we’ll capture 1%, so $500 million” with no filtering logic in between.
- No source citation. A number with no attached source is a guess wearing a suit.
Run these validation checks before you finalize any figure:
- Back-of-envelope capacity check. Does your SOM require more sales activity than your current or planned headcount can physically produce?
- Cross-method parity. Do your top-down and bottom-up figures land within roughly 15% of each other?
- Source documentation. Can every input be traced to a report, a CRM export, or a named assumption?
Pro Tip: Present a range instead of a single point estimate. “$3.8M to $5.2M depending on rep ramp speed” reads as rigor. A single confident number reads as either luck or spin.
How Should You Present TAM, SAM, SOM to Investors?
A single slide should carry the full story, structured this way:
- One sentence per metric. “TAM: $735M US healthcare scheduling market. SAM: $147M serving clinics under 20 employees. SOM: $4.5M in year one based on an 8-rep sales team.”
- Show the SOM math directly on the slide. Reps × activity × close rate × ACV, not just the final figure.
- Label every assumption. If your close rate is a benchmark rather than historical data, say so.
Sample wording that reads as credible rather than inflated: “Our SAM reflects clinics reachable through our current outbound and partner channels. Our SOM assumes 4 closed deals per rep per month, in line with our first two quarters of actual sales data.”
Add a short sensitivity view, even just three rows, showing SOM under a conservative, base, and upside scenario:
- Conservative: slower rep ramp, lower close rate
- Base case: current trailing close rate held flat
- Upside: faster ramp plus one additional channel partner
That range signals you understand your own uncertainty, which experienced investors read as maturity rather than weakness. Tools like Scribe can help translate this math into pitch-ready slide wording without losing the underlying rigor.
Where Do You Find Reliable Data for Market Sizing?
Pick your source based on what you’re trying to answer, not just whichever report ranks first in a search.
For top-down category figures, government data from the Bureau of Labor Statistics gives you free, defensible baselines for labor and industry-level trends. Paid analyst reports from Gartner or IDC go deeper into specific software or hardware categories, and they’re worth the cost once you’re raising a serious round where investors will ask about your sourcing. Statista and IBISWorld sit in between: broad category coverage at a lower price point than the enterprise analyst firms.
For bottom-up inputs, your own CRM and analytics stack matter more than any external report. Track addressable account counts, funnel conversion rates, and ACV directly. A roundup of AI tools founders use in 2026 covers several options for speeding up this data collection without hiring an analyst.
Buy a paid report when the category is unfamiliar and you need a credible third-party anchor for investors. Skip it and build bottom-up when you already have real customer or pilot data. For competitive density, a guide to competitive analysis for websites offers a practical framework for estimating how many rivals are already chasing the same SOM you’re modeling.
How Do You Validate Your Market Sizing in the Next 90 Days?
Run this checklist before you lock in any figure for a fundraise or an annual plan:
- Week 1 to 2: Pull your top-down category figure from a named source (Gartner, Statista, BLS, or a relevant trade association) and log the exact filter you’ll apply.
- Week 2 to 4: Build your bottom-up spreadsheet with addressable accounts, ACV, and current conversion rates pulled straight from your CRM.
- Week 4 to 8: Run a small validation experiment, a landing page test, a paid pilot, or ten structured customer interviews, to check your price and adoption assumptions.
- Week 8 to 12: Interview two or three sales reps or advisors about realistic activity capacity before you finalize your SOM math.
Log every source, assumption, and experiment result in the same spreadsheet tab where you calculate the final numbers, so revisions six months from now start from evidence instead of memory. A quick guide to validating a business idea walks through the kind of lightweight testing that feeds directly into this process.
Pro Tip: Revisit your SOM every quarter, not once a year. Close rates and rep ramp change faster than most founders update their model, and a stale SOM is worse than an honest range.
A Founder’s View on Turning TAM Into a Real Plan
Most founders start with a fuzzy, inflated TAM pulled from a press release, because it’s fast and it feels good on slide three. The useful shift happens when you stop treating that number as a plan and start building SOM from your own sales capacity instead. That’s the moment market sizing stops being a pitch exercise and starts being an operating tool.

The practical habit worth building early: update SOM every quarter using your actual close rate, not the assumption you started with. Pro Tip: Keep TAM on the vision slide and SOM on the operating spreadsheet. Mixing the two is where most annual plans quietly go wrong.
How Vora IQ Helps You Turn Market Size Into a Working Plan
Building a defensible SOM by hand means juggling CRM exports, analyst reports, and a spreadsheet that breaks the moment your close rate changes. Vora IQ was built specifically for solo founders who need that math done without hiring an analyst or a full ops team.
Inside Vora IQ, market and competitor analysis feeds directly into your adaptive roadmap, so a revised SOM automatically reshapes your quota targets and hiring plan instead of sitting stuck in an old spreadsheet tab. The features page walks through exactly how the market analysis, financial modeling, and roadmap tools connect. If you want to see how founders across different industries have used these tools to move from a rough TAM to an operating plan, the use cases page covers the range of businesses Vora IQ supports. Start with a free Idea Report Card and run your own bottom-up SOM calculation this week, before your next investor conversation forces you to explain a number you haven’t stress-tested yet.
Sources
- How to calculate your startup’s TAM, SAM and SOM | TechCrunch
- TAM, SAM, SOM Explained: A Practical Market Sizing Guide | Polaris Market Research
- Apparel data in fashion | BLS
- TAM, SAM, SOM | HubSpot Blog
- TAM vs. SAM vs. SOM | Revenue Analytics Glossary | ORM