
MRR vs ARR: The SaaS Metrics Guide for Founders
By Vora IQ Team
Unlock the key differences between MRR vs ARR in this comprehensive guide. Learn how to leverage these metrics for optimal SaaS growth!
- mrr vs arr

MRR is your normalized monthly subscription revenue. ARR is that same number expressed annually: ARR = MRR × 12. Both metrics count only recurring charges — no setup fees, no one-time payments, no professional services. Get that boundary right, and everything else follows.
Here’s the quick split every founder needs to know:
- MRR is your operational pulse. Founders, product teams, and customer success use it daily to catch churn early, measure a pricing test, or track a new cohort’s momentum.
- ARR is your strategic headline. Investors, boards, and finance teams use it to benchmark scale, model valuation multiples, and plan annual budgets.
- Both metrics live in the same formula. MRR captures short-term momentum and is sensitive to new sales, churn, and upgrades; ARR smooths that volatility for long-term planning.
The rest of this guide walks through exact formulas, calculation scenarios, metric variants, and a one-week audit checklist you can run this week.
Table of Contents
- What MRR and ARR actually mean (and how to calculate them)
- How to calculate MRR in four real scenarios
- The metric variants you need to track
- MRR vs ARR: when to use each one
- Worked examples and a conversion cheat sheet
- How MRR and ARR shape your forecasts, budgets, and investor conversations
- Run this one-week billing audit to clean up your numbers
- Key Takeaways
- Why clean metrics are the foundation of every good founder decision
- Useful sources and further reading
What MRR and ARR actually mean (and how to calculate them)
ARR is the annualized run rate of recurring revenue. The formula is simple:
ARR = MRR × 12
MRR itself is the sum of all normalized monthly recurring charges across your active subscribers. “Normalized” is the key word. A customer on a $1,200 annual plan contributes $100/month to MRR, not $1,200 in the month they paid.
Annual Contract Value (ACV) is a related but distinct term. ACV measures the annualized value of a single contract, which matters when you have multi-year deals or variable add-ons. ACV can differ from ARR when a contract includes one-time implementation fees or usage overages that aren’t recurring.
Include in MRR/ARR:
- Fixed monthly subscription fees
- Annual or multi-year plan fees (divided by contract months)
- Recurring add-ons and seat expansions
- Committed usage tiers billed monthly
Exclude from MRR/ARR:
- One-time setup or onboarding fees
- Professional services and consulting
- Non-recurring discounts or credits
- Variable usage charges above a committed tier
- Taxes
One-time fees are the most common inflation error. Including a $500 setup charge in MRR makes your growth look better for exactly one month, then creates a false contraction when it doesn’t repeat. Keep the boundary clean.
How to calculate MRR in four real scenarios
Knowing the formula is one thing. Applying it to your actual billing system is another. Here are the four situations you’ll hit most often.
-
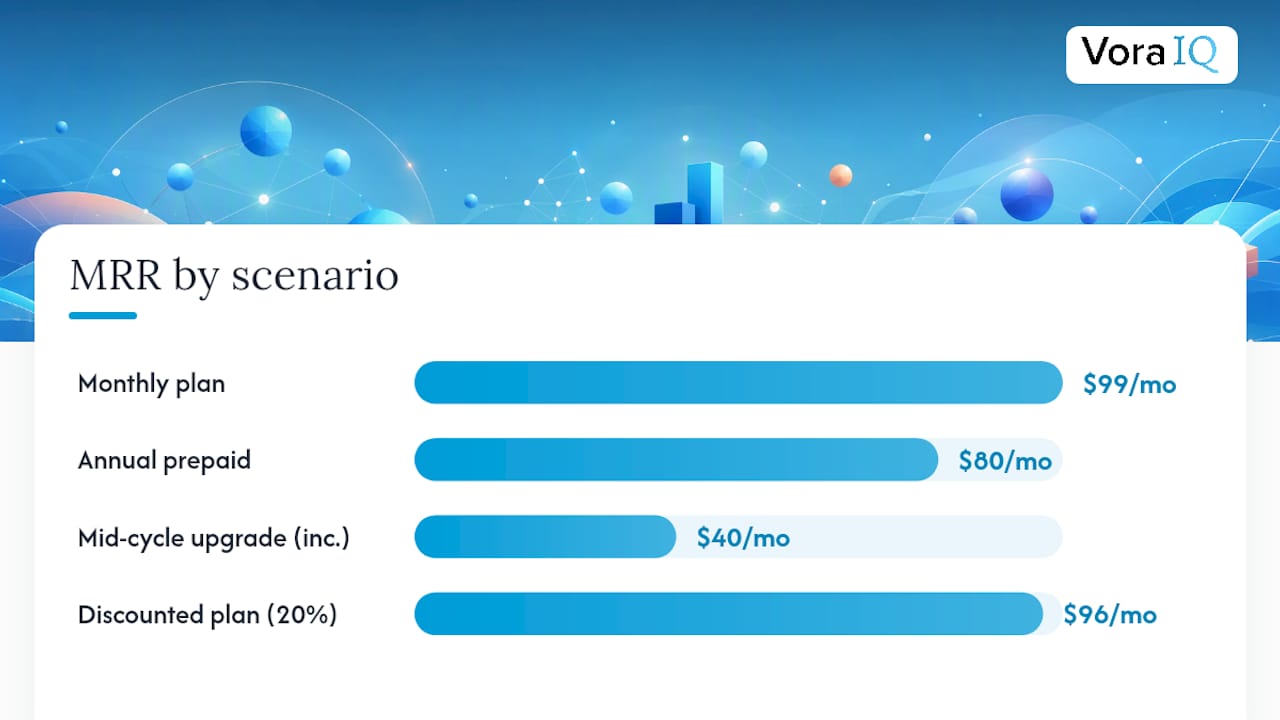
Pure monthly plan. A customer pays $99/month. Their MRR contribution is $99. Straightforward. Sum all active monthly subscribers and you have gross MRR.
-
Annual prepaid plan. A customer pays $960 upfront for a year. Divide by 12: $80/month MRR. Do not record $960 in month one. Your billing system should recognize this as $80 each month across the contract term.
-
Mid-cycle upgrade (proration). A customer upgrades from $80/month to $120/month on day 15 of a 30-day billing cycle. The incremental MRR added is $40. For the partial month, prorate the charge ($20 for the remaining 15 days), but record the full $40 expansion MRR starting the following month. Mixing prorated billing amounts with MRR figures is a common source of spreadsheet errors.
-
Discounts and credits. A customer on a $120/month plan receives a 20% promotional discount for three months. Their MRR contribution during the discount period is $96, not $120. Record actual contracted recurring revenue, not list price.
Pro Tip: Set a single source of truth for MRR in your billing system — Stripe, for example, lets you tag charges as recurring or one-time. Pull MRR from that tag, not from total revenue. This prevents one-offs from contaminating your recurring metrics every month.
Concrete conversion examples like $5,000 MRR → $60,000 ARR and normalizing annual contracts to monthly equivalents are standard practice for sanity-checking your numbers.
The metric variants you need to track
Gross MRR and net MRR tell very different stories. Gross MRR is the total recurring revenue before accounting for any losses. Net MRR factors in churn and contraction. A business with $50k gross MRR but $8k in monthly churn has $42k net MRR — and that gap is where growth goes to die.
ARR and MRR each decompose into four components:
| Component | Definition | Who owns it |
|---|---|---|
| New MRR/ARR | Revenue from brand-new customers | Sales |
| Expansion MRR/ARR | Upgrades, upsells, seat adds from existing customers | Customer Success |
| Contraction MRR/ARR | Downgrades or plan reductions from existing customers | Customer Success |
| Churned MRR/ARR | Revenue lost from cancellations | CS + Product |
Net Revenue Retention (NRR) ties these components together. The formula:
NRR = (Starting MRR + Expansion MRR − Contraction MRR − Churned MRR) ÷ Starting MRR × 100
NRR combines expansion and churn effects and shows whether your existing customer base is a net growth engine or a net drag. An NRR above 100% means your existing customers are growing faster than they’re leaving. Below 100%, you’re losing ground even before counting new sales.
- NRR above 120% is a strong signal investors look for in growth-stage SaaS.
- NRR below 90% means new customer acquisition is running to fill a leaky bucket.
- Track NRR monthly alongside gross MRR to separate acquisition performance from retention performance.
MRR vs ARR: when to use each one
The difference isn’t just timeframe. It’s about what question you’re trying to answer.
MRR answers: What happened this month, and why? It’s sensitive enough to show you a pricing test result in 30 days, flag a churn spike before it compounds, or confirm that a new onboarding flow is improving activation. That sensitivity is a feature for operators, not a bug.
ARR answers: How big is this business, and where is it going? Investors apply revenue multiples to ARR. Annual budgets are built on ARR projections. Hiring plans, office leases, and marketing spend commitments all anchor to ARR because it smooths the noise.
Practical rules of thumb:
- Use MRR for product experiments, pricing changes, cohort analysis, and monthly operating reviews.
- Use ARR for annual planning, board decks, and any external communication about company scale.
- Use both in fundraising materials — ARR for the headline, MRR trend for the growth story.
Pro Tip: Reporting ARR too early can actually obscure your momentum. Founders should lean on MRR for operational decisions until roughly $1M ARR, after which ARR becomes the primary language for fundraising and valuation. Before that threshold, a flat ARR number hides the month-over-month acceleration that tells the real story.
One more thing worth knowing: as ARR scales into the tens of millions, a single percentage point of churn moves a material dollar amount annually. That’s when retention stops being a customer success metric and becomes a board-level priority.
Worked examples and a conversion cheat sheet
Put the formulas to work with these quick examples.
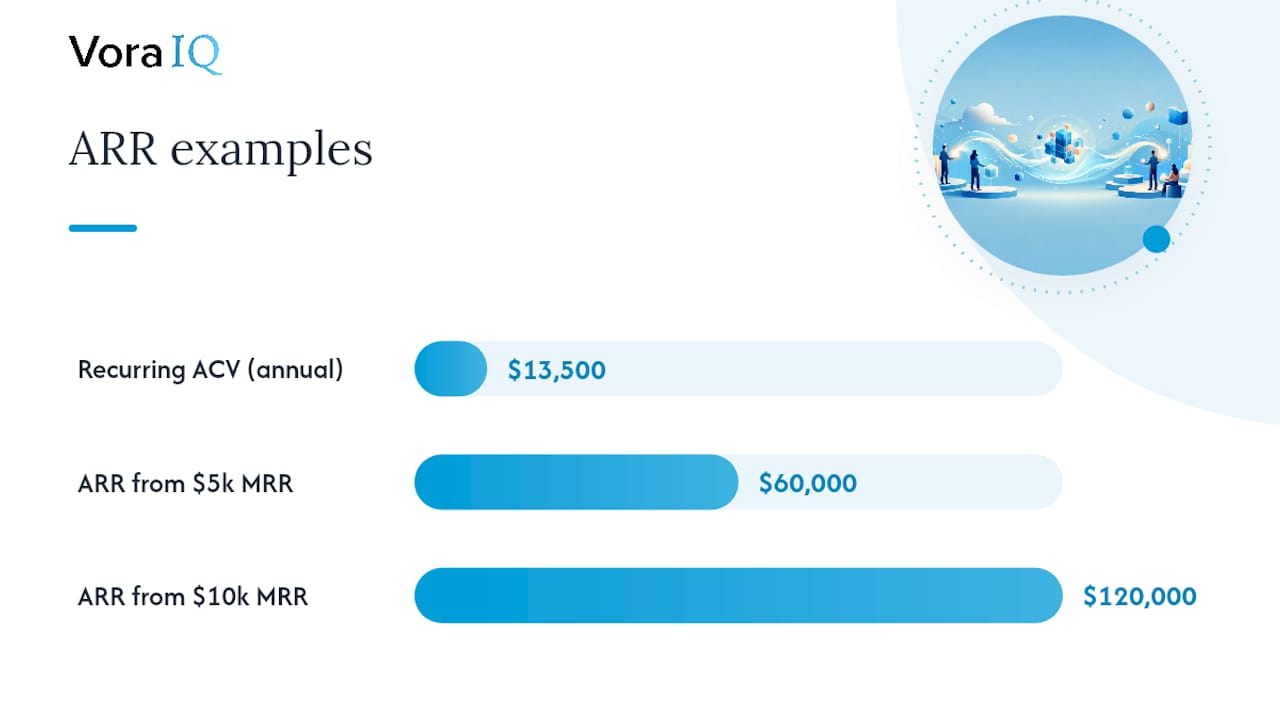
$5,000 MRR: ARR = $5,000 × 12 = $60,000. At this stage, you’re in early operational growth before reaching a substantial annual recurring revenue milestone. MRR is your primary operating metric.
$10,000 MRR: ARR = $10,000 × 12 = $120,000. You have roughly 120 customers at $100 ARPA, or 40 customers at $300 ARPA. The MRR figure tells you more about daily momentum than the ARR headline does.
Annual contract example: A customer signs a $15,000 annual contract that includes a $1,500 one-time implementation fee. Recurring ACV = $13,500. Monthly MRR contribution = $13,500 ÷ 12 = $1,125. The $1,500 setup fee never enters MRR.
Conversion cheat sheet:
| MRR | ARR | ARPA (at 100 customers) |
|---|---|---|
| Moderate recurring revenue monthly | Corresponding annualized recurring revenue | Approximate average revenue per account per month |
| Higher recurring revenue monthly | Larger annualized figure reflecting growth | Reflects higher per account average revenue |
| Substantial monthly recurring revenue | Significant annual recurring revenue | Indicates mid-to-high average revenue per account |
| Large monthly recurring revenue | Substantial annualized recurring revenue | Corresponds to significant average revenue per account |
Quick validation checklist before you publish any MRR/ARR figure:
- All annual contracts divided by contract months (not counted as lump sums)
- One-time fees removed from recurring revenue
- Discounts applied at contracted rate, not list price
- Churned customers removed as of cancellation date, not invoice date
- Expansion revenue added in the month the upgrade took effect
How MRR and ARR shape your forecasts, budgets, and investor conversations
Investors apply valuation multiples to ARR — not to revenue, not to bookings. Pure subscription ARR typically commands higher multiples than ARR padded with one-time fees, because recurring revenue is more predictable. Valuation multiples are applied to ARR, but investors adjust for revenue quality — which means inflating ARR with non-recurring items actively hurts your valuation conversation.
ARR also connects directly to unit economics. A healthy LTV/CAC ratio is around 3x and helps you interpret whether ARR growth is economically sustainable. If you’re growing ARR at 15% monthly but your CAC payback period is 24 months, you have a cash flow problem hiding behind a growth story. Tracking the LTV to CAC ratio alongside ARR gives you the full picture.
For forecasting, use MRR for 90-day sensitivity models — it’s granular enough to show the impact of a 5% churn increase or a new pricing tier. Use ARR for 12–24 month planning and board-level targets.
Pro Tip: In a pitch deck, lead with ARR as your scale headline, then show the MRR growth chart to demonstrate momentum. Investors want to see both: the size of the business today and the velocity it’s moving at. A flat ARR with accelerating MRR is a better story than a high ARR with decelerating monthly growth.
- Short-term forecasting: build from MRR components (new, expansion, churn) month by month.
- Annual budget: anchor to ARR targets and work backward to required new MRR per month.
- Hiring plan: tie headcount additions to ARR milestones, not to monthly revenue spikes.
Run this one-week billing audit to clean up your numbers
You don’t need a finance team to get accurate MRR and ARR. You need a clear process and one focused week.
-
Export your billing data. Pull every active subscription from your billing system with contract start date, billing frequency, and charge amount. Stripe, Recurly, and similar platforms let you export this as a CSV.
-
Tag every charge as recurring or one-time. Flag setup fees, professional services, and any non-repeating line items. These come out of your MRR calculation entirely.
-
Normalize annual and multi-year contracts. Divide each annual contract’s total recurring value by 12. Divide multi-year contracts by total contract months. Update your MRR spreadsheet with the monthly equivalent.
-
Recalculate MRR components. Separate new MRR (customers who started this month), expansion MRR (upgrades), contraction MRR (downgrades), and churned MRR (cancellations). Sum them to get net new MRR.
-
Calculate NRR. Use the formula from the metric variants section. If your NRR is below 100%, identify the top three accounts driving contraction or churn before moving on.
-
Verify ARR. Multiply your clean MRR by 12. Compare it to any ARR figure you’ve previously reported. Reconcile discrepancies before they compound.
-
Prioritize fixes by impact. Billing errors on high-value accounts move the headline number most. Fix those first. Mis-tagged one-offs in the $50–$200 range matter less at early stage but create noise in trend analysis.
Fixes that move the needle most:
- Annual contracts recorded as lump-sum revenue (not normalized)
- Churned customers still counted as active subscribers
- Discounted contracts recorded at list price
The Ledger AI CFO agent inside Vora IQ automates much of this reconciliation, pulling from your billing integrations and flagging normalization errors before they reach your reporting.
Key Takeaways
MRR is your operational signal; ARR is your strategic headline — and keeping both clean requires excluding one-time fees, normalizing annual contracts, and tracking all four revenue components every month.
| Point | Details |
|---|---|
| Core formula | ARR = MRR × 12; both metrics include only normalized recurring charges. |
| Normalization rule | Divide annual contracts by 12; never count setup fees or one-time charges as recurring. |
| Metric to use when | Use MRR for ops and product decisions; switch to ARR as your primary headline at $1M ARR. |
| Track all four components | New, Expansion, Contraction, and Churn MRR reveal where growth actually comes from. |
| Run the audit now | A one-week billing audit catches the errors that inflate or deflate your headline metric. |
Why clean metrics are the foundation of every good founder decision
Most founders I talk to treat MRR and ARR as reporting outputs. They calculate them once a month, drop them into a dashboard, and move on. That’s the wrong frame. These metrics are decision inputs — and dirty inputs produce bad decisions.
Here’s what gets overlooked: the gap between gross MRR and net MRR is often where a business’s real story lives. A founder reporting $30k MRR with $8k in monthly churn isn’t running a $30k MRR business. They’re running a $22k net MRR business with a serious retention problem. Reporting the gross number to investors without the net figure isn’t just misleading — it delays the moment you actually fix the underlying issue.
The $1M ARR threshold matters for a specific reason. Below that level, month-over-month MRR growth tells you more about trajectory than any annualized figure. A business at $80k ARR growing 15% monthly is a fundamentally different animal than one at $80k ARR growing 2% monthly. ARR flattens that distinction. MRR preserves it.
One more thing founders consistently underestimate: NRR is the single metric that separates a business with product-market fit from one that’s just acquiring its way through churn. You can build a one-person business with strong NRR and modest new sales. You cannot build a durable business with weak NRR and strong new sales — the math eventually catches up.
Get the metrics right first. Everything else — forecasting, fundraising, hiring — gets cleaner from there.
Useful sources and further reading
These are the primary sources behind this guide, plus a short reading path for founders who want to go deeper.
- Understanding Recurring Revenue: MRR and ARR
- What is ARR? Here’s how to calculate it | Stripe
- MRR and ARR: Core SaaS Revenue Metrics
- Annual Recurring Revenue (ARR) | Formula + Calculator
- MRR vs ARR
- LTV/CAC — Harvard Business School Online
- Annual Recurring Revenue (ARR) — Salesforce
For founders who want to run the billing audit described in this guide using an integrated workflow, Vora IQ’s features page covers the financial modeling and billing integration capabilities that automate normalization and component tracking.