
SaaS Churn Reduction: The 90-Day Playbook That Works
By Vora IQ Team
Discover effective strategies for SaaS churn reduction in our 90-day playbook. Lower churn now with actionable insights and proven methods.
- saas churn reduction

The fastest path to lower churn runs through four levers in this order: diagnose your voluntary/involuntary split, fix onboarding so customers hit first value fast, automate payment recovery, and install a cancel flow with a proactive health-score system behind it. Payment recovery and cancel-flow saves show up in your numbers within 30 days. Onboarding and health scoring take 60 to 90 days to compound. Track logo churn, revenue churn, and time-to-first-value starting this week.
TL;DR:
- Fix involuntary churn primarily through payment recovery by optimizing dunning sequences, since it can reduce total churn by around 10% within one billing cycle.
- Prioritize onboarding efforts to reach first value within 30 days, significantly increasing customer retention and making this the highest leverage fix over months.
- Use cohort retention analysis and split voluntary from involuntary churn to accurately diagnose your specific issues before applying targeted solutions.
- Implement a simple rule-based health score focused on login activity, feature adoption, support sentiment, and billing status to identify at-risk accounts early.
- Follow a structured 90-day plan: address payment issues first if involuntary churn exceeds 25%, then improve onboarding and cancel flow, tracking progress with precise KPIs weekly.
Table of Contents
- What Good SaaS Churn Reduction Looks Like in 2026
- How Do You Measure Churn Correctly?
- How Do You Diagnose the Real Cause of Churn?
- Which Interventions Cut Churn Fastest?
- Building Predictive Systems to Catch Churn Early
- Running Your 90-Day Churn-Reduction Plan
- Why Small Churn Gains Compound Into Big Outcomes
- A Faster Way to Turn This Playbook Into a Working Roadmap
- Sources
What Good SaaS Churn Reduction Looks Like in 2026
Most founders benchmark against the wrong number. The median B2B SaaS company reports annual churn near 3.5%, split roughly into 2.6% voluntary and 0.8% involuntary.
Benchmarks shift hard by ARPU and stage. A $15/month self-serve tool will always churn faster than a $2,000/month enterprise contract, because switching costs and buyer scrutiny differ by an order of magnitude. According to Retainly’s benchmark research, companies crossing roughly $500,000 in ARR need retention infrastructure, cohort analysis, cancel flows, and payment recovery, already built, because that’s when churn starts eating growth instead of just annoying you.
Blended churn (one number covering your whole customer base) hides the story. You can’t prioritize fixes without knowing which.
Use this table to set a realistic 90-day target based on where you stand today:
| Current monthly churn | Primary driver to check first | Realistic 90-day target |
|---|---|---|
| Under 2% | Health scoring, expansion | Hold steady, focus on expansion revenue |
| 2% to 4% | Onboarding activation | 15% to 25% relative reduction |
| 4% to 7% | Payment recovery, cancel flow | 25% relative reduction |
| Over 7% | Product fit, support friction | Stabilize first, then reduce |
If your involuntary share is a large proportion of your total churn, start with payment recovery. It’s the fastest fix you have.
How Do You Measure Churn Correctly?
Most churn math gets fudged by mixing metrics that answer different questions. Fix that first.
- Logo churn (customer count): (Customers lost in period ÷ Customers at start of period) × 100. Use this to gauge product-market fit and support quality.
- Revenue churn (MRR/ARR): (MRR lost to cancellations and downgrades ÷ MRR at start of period) × 100. This is what your board actually cares about, since losing one $50,000 account hurts more than losing ten $10 accounts. Our MRR vs. ARR breakdown walks through when each framing matters.
- Net revenue retention: factor in expansion revenue alongside churn to see whether upgrades are offsetting losses.
Blended monthly averages flatten the signal you actually need. Cohort retention tables fix that: group customers by signup month, then track what percentage of each cohort survives in months 1, 3, 6, and 12. A practical cohort analysis makes it obvious whether a January pricing change tanked retention for everyone who joined after it, something a single blended number would bury for months.
Activation matters more than almost any other metric you’ll track. One of the more consistent findings in churn research: customers who reach a product’s first meaningful value moment within 30 days retain at dramatically higher rates than those who don’t, according to Kayako’s churn research. Define that value moment concretely (first report generated, first integration connected, first team member invited) and instrument it as an event, not a guess.
Finally, split voluntary from involuntary churn using your billing logs:
- Involuntary: failed card, expired payment method, insufficient funds
- Voluntary: explicit cancellation, downgrade to zero, non-renewal
Pull cancel-flow survey responses into the same dataset. Without that split, you’ll spend engineering time on product fixes when the real leak is expired credit cards.
How Do You Diagnose the Real Cause of Churn?
Skipping diagnosis is the single most expensive mistake in churn reduction. Build these four data views before you touch a single tactic:
- Cohort retention curves by signup month, segmented by plan tier and acquisition channel.
- Time-to-first-value distribution: what percentage of new users hit your activation event in 7, 14, and 30 days?
- Payment-failure log: decline reasons, retry outcomes, and days between failure and cancellation.
- Cancel-flow survey responses, tagged by category (price, missing feature, switched competitor, no longer needed).
Reading these signals tells you what kind of problem you actually have. If cohort curves show a steep drop at day 3 to 5 across every acquisition channel and every plan tier, that’s a product-fit or onboarding problem, not an infrastructure one. If the drop is concentrated among customers on a specific payment processor, or clusters right after monthly renewal dates, you’re looking at an infrastructure or billing issue. ChurnTools’ playbook makes the same point: churn is heterogeneous, and the highest-leverage move is correctly identifying which type you’re facing before applying a fix built for a different one.
Your support data adds a second lens. Repeated tickets on the same feature, declining CSAT scores tied to specific workflows, or lengthening time-to-resolution all point toward friction that pushes borderline customers toward the exit. Forrester’s research on service trends found that faster, more human, context-rich support correlates directly with retention. If your support agents can’t see billing history, plan tier, and usage data in one screen, that’s costing you renewals right now.

Pro Tip: Run a simple SQL query joining your cancel-flow survey table against your billing table by customer ID. If “too expensive” cancellations cluster on customers who also had a recent failed payment, you’re not looking at a pricing problem. You’re looking at a billing-friction problem wearing a pricing costume.
Which Interventions Cut Churn Fastest?
Not every fix deserves equal attention in month one. Rank these by how fast they pay back and how much lift they typically produce.
1. Onboarding and time-to-value. Map your activation event, then build a milestone-driven flow that gets new users there inside their first session, not their first week. In-app checklists and contextual nudges (not another welcome email) close the gap fastest. Since first-value-within-30-days is the strongest single retention predictor available, this belongs at the top of your roadmap even though its payoff shows up over months, not days.
2. Payment recovery and dunning. This is the fastest win on the list. Involuntary churn typically represents 20% to 40% of total churn, and optimized dunning sequences, precision retry timing instead of blind daily retries, pre-expiry card update prompts, and grace-period messaging, can recover a meaningful share of failed payments. Stripe’s guidance adds that transparent invoicing and pre-expiry reminders raise payment success rates further. Compare that to onboarding fixes, which take a full quarter to show up in your cohort data: dunning automation can move your involuntary number within one billing cycle.
Recovery math worth knowing: if involuntary churn is 30% of your total and precision dunning recovers even a third of those failed payments, you’ve cut total churn by roughly 10% without touching your product, your pricing, or your support team.
3. Cancel flow with pause and downgrade options. A generic “are you sure?” screen saves almost nobody. A cancel flow that captures the reason, then offers a relevant alternative (pause for seasonal businesses, downgrade for over-buyers, a discount for price-sensitive accounts) performs measurably better. Churnkey’s data shows pause and skip options retaining 20% to 30% more customers than a flat cancellation path.
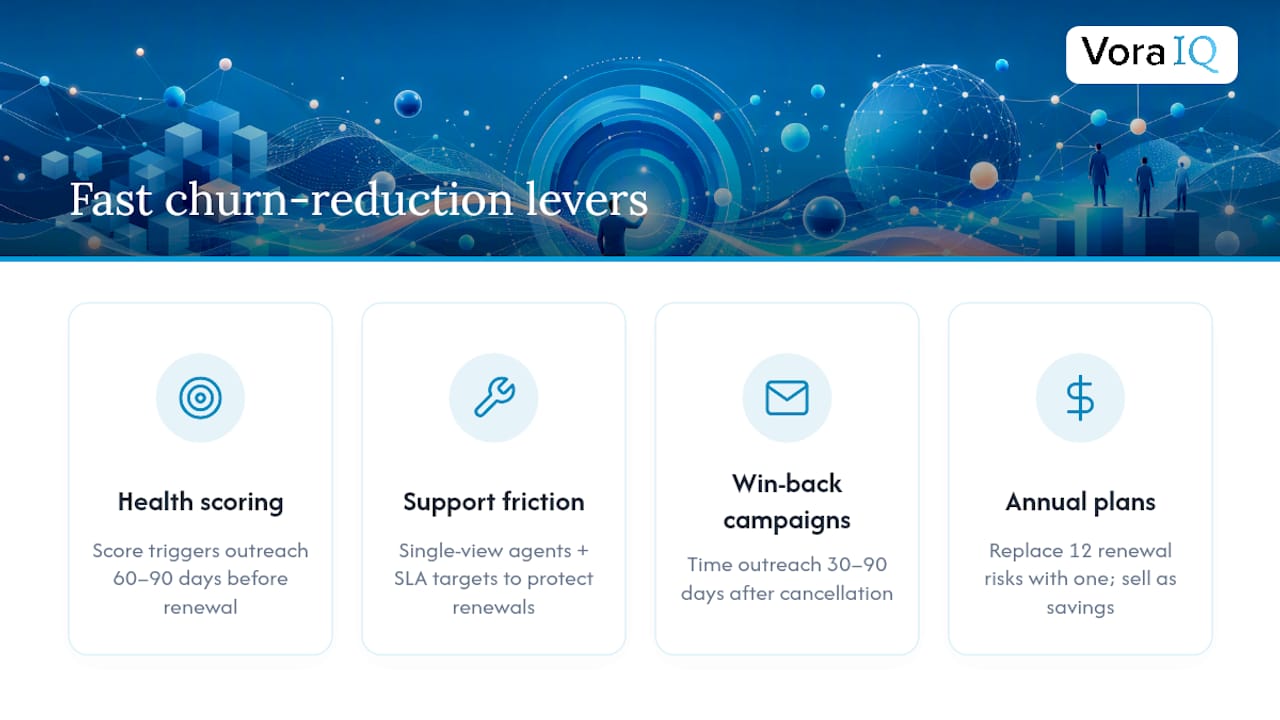
4. Health scoring and proactive CS playbooks. Build a score from usage frequency, feature adoption breadth, support ticket sentiment, and payment health. Trigger human outreach 60 to 90 days before renewal when a score drops, not after the cancellation email arrives.
5. Support friction reduction. Give agents single-view context (plan, billing status, usage, past tickets) and set SLA targets around first-response time. Every rep who has to ask “what plan are you on?” is losing a renewal in slow motion.
6. Win-back campaigns. Time outreach 30 to 90 days post-cancellation, when the customer’s reason for leaving may have changed (budget cycle reset, new hire needs the tool again) but before they’ve fully forgotten your product.
7. Annual plan incentives. Moving month-to-month customers to annual contracts removes twelve renewal risk points and replaces them with one. Communicate the switch as a savings decision, not a lock-in.
Building Predictive Systems to Catch Churn Early
Start with a rule-based health score before you touch machine learning. A spreadsheet formula that flags “logged in fewer than 3 times in 14 days AND hasn’t used core feature in 30 days” will catch most of your at-risk accounts for a fraction of the engineering cost of a predictive model.
A workable MVP health score typically weights:
- Login frequency and recency (30%)
- Core feature adoption breadth (25%)
- Support ticket sentiment or CSAT (20%)
- Payment health, failed charges, and near-expiry cards (25%)
Backtest any scoring model against 6 to 12 months of historical cohorts before trusting it. Pull the accounts that actually churned and check whether your rules would have flagged them 30 to 60 days out. If your rules only catch churn the week before cancellation, they’re not predictive, they’re just confirming what already happened. Gartner’s churn-prevention research recommends pairing this kind of analytics with concrete operational playbooks, since a score with no follow-up action is just an interesting number.
Pro Tip: Route your highest-risk accounts (top 10% by risk score) to human CS outreach, and let automation handle the middle tier with in-app nudges and email sequences. Reserve your team’s limited time for the accounts where a phone call actually moves the needle.
Running Your 90-Day Churn-Reduction Plan
Start with a decision rule, not a wish list. If involuntary churn exceeds 25% of your total, fix payment recovery first. It’s fast, measurable, and doesn’t require product changes. Otherwise, start with onboarding and cancel flow in parallel, since one drives activation and the other stops the bleeding from customers already circling the exit.
- Days 1 to 30: Instrument cohort tracking and activation events. Ship dunning automation and pre-expiry payment reminders. Assign billing ownership to one person.
- Days 31 to 60: Launch the redesigned cancel flow with reason capture and offers. Build the MVP health score. Assign CS ownership for proactive outreach on flagged accounts.
- Days 61 to 90: A/B test cancel-flow offer variants and dunning message timing. Review cohort data for onboarding lift. Report incremental churn reduction against your baseline.
| Week | Owner | KPI to track |
|---|---|---|
| 1 to 4 | Billing/Eng | Payment recovery rate, involuntary churn % |
| 5 | CS/Product | Cancel-flow save rate, health-score coverage |
| 9 | Founder/CS lead | Net logo churn, cohort retention at day 30 |
Practical execution discipline like this is exactly what separates teams that talk about reducing churn from teams that actually operate on a plan instead of endlessly re-strategizing it.
Why Small Churn Gains Compound Into Big Outcomes
A one-point drop in monthly churn looks unimpressive on a slide. Compounded over three years of growth, it’s the difference between a business that scales its customer base and one that runs on a treadmill replacing everyone it loses. That’s why understanding customer lifetime value changes how founders prioritize retention work versus acquisition spend.
What gets underestimated: most teams treat churn reduction as a product problem when the fastest wins live in billing and cancel-flow copy, not the roadmap. Instrument first, test one variable at a time, measure the incremental effect against a real baseline, and iterate. Skip the instinct to fix five things at once. You won’t know which one worked, and neither will your next quarter’s plan.
— Khalel
A Faster Way to Turn This Playbook Into a Working Roadmap
Building the dashboards, health scores, and 90-day plans above from scratch usually eats weeks you don’t have. Vora IQ turns this playbook into a living roadmap built around your actual metrics, not a generic template.
Inside Vora IQ, you get:
- An adaptive roadmap that sequences your onboarding fixes, dunning rollout, and cancel-flow tests based on your stage and current churn split.
- Daily task automation that keeps billing, CS, and product owners moving without a separate project-management tool.
- Echo, an AI social media agent, for retention messaging and win-back campaign content, so your CS team isn’t writing every email from scratch.
You still run the diagnostics and make the calls. Vora IQ just removes the setup tax between deciding what to fix and actually shipping it. If you’re comparing planning tools to get there, see how Vora IQ stacks up against other business plan software built for solo founders and early-stage teams, then start your roadmap today.
Sources
- What Is Customer Churn Rate? A Complete Guide (2026) - Kayako
- 14 tactics to reduce subscription churn (Churnkey)
- How to Reduce Churn Rate: The Definitive SaaS Playbook (ChurnTools)
- SaaS Churn Rate Benchmarks 2026: What Good Actually Looks Like · Retainly